 | ||||||
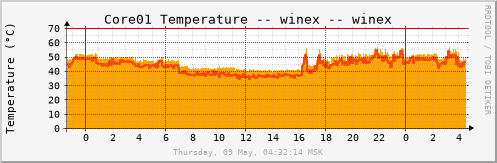
| Core0: | 38.0 °C max | 36.6 °C avg | Core0: 37.0 °C | |||
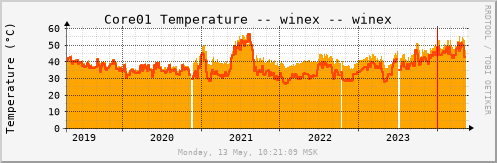
| Core1: | 58.9 °C max | 48.6 °C avg | Core1: 47.2 °C | |||
|
| ||||||
| Core0: | 38.0 °C max | 36.6 °C avg | Core0: 37.0 °C | |||
| Core1: | 58.9 °C max | 48.6 °C avg | Core1: 47.2 °C | |||
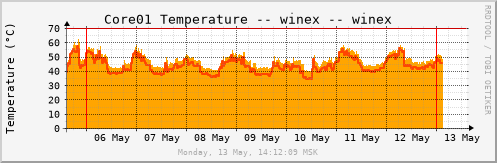 | ||||||
| Core0: | 38.7 °C max | 36.4 °C avg | Core0: 37.0 °C | |||
| Core1: | 61.7 °C max | 47.7 °C avg | Core1: 47.6 °C | |||
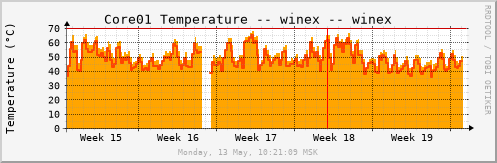 | ||||||
| Core0: | 39.2 °C max | 36.5 °C avg | Core0: 36.0 °C | |||
| Core1: | 66.1 °C max | 50.7 °C avg | Core1: 47.0 °C | |||
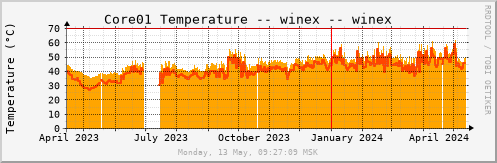 | ||||||
| Core0: | 56.6 °C max | 44.0 °C avg | Core0: 36.7 °C | |||
| Core1: | 56.2 °C max | 40.8 °C avg | Core1: 48.9 °C | |||
 | ||||||
| Core0: | 60.5 °C max | 44.0 °C avg | Core0: 36.5 °C | |||
| Core1: | 57.6 °C max | 39.0 °C avg | Core1: 47.7 °C | |||
| Orange ### | Incoming Traffic in Bytes per Second |
| OrangeRed ### | Outgoing Traffic in Bytes per Second |
|
|
|
|
version 2.17.10 |
Tobias Oetiker <tobi@oetiker.ch> |
and Dave Rand <dlr@bungi.com> |
|
mrtg-rrd.cgi version 1.0 |
Jan "Yenya" Kasprzak <kas@fi.muni.cz> |